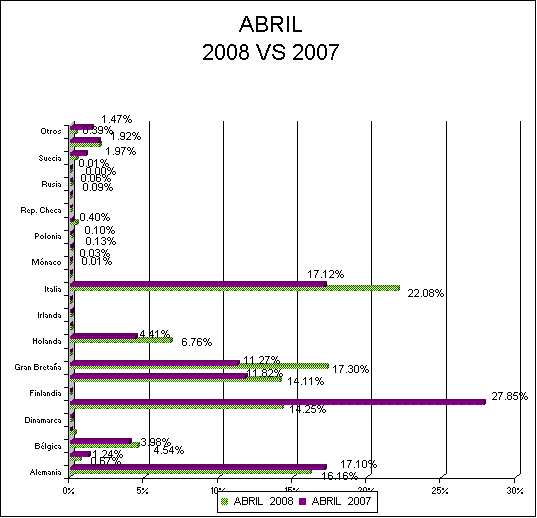


|
|||||||||||||
| DESGLOSE DE PROCEDENCIA GEOGRÁFICA | |||||||||||||
| DEL TURISMO EUROPEO | |||||||||||||
| A B R I L 2008 VS 2007 | |||||||||||||
| ABRIL 2008 | ABRIL 2007 | 
|
|||||||||||
| PAIS | PAX | % | PAX | % | |||||||||
| Alemania | 11,456 | 16.16% | 11,107 | 17.10% | |||||||||
| Austria | 475 | 0.67% | 803 | 1.24% | |||||||||
| Bélgica | 3,222 | 4.54% | 2,586 | 3.98% | |||||||||
| Bulgaria | 210 | 0.30% | 0 | 0.00% | |||||||||
| Dinamarca | 69 | 0.10% | 76 | 0.12% | |||||||||
| España | 10,103 | 14.25% | 18,086 | 27.85% | |||||||||
| Finlandia | 11 | 0.02% | 9 | 0.01% | |||||||||
| Francia | 10,006 | 14.11% | 7,673 | 11.82% | |||||||||
| Gran Bretaña | 12,266 | 17.30% | 7,318 | 11.27% | |||||||||
| Grecia | 7 | 0.01% | 9 | 0.01% | |||||||||
| Holanda | 4,793 | 6.76% | 2,863 | 4.41% | |||||||||
| Hungria | 55 | 0.08% | 23 | 0.04% | |||||||||
| Irlanda | 71 | 0.10% | 47 | 0.07% | |||||||||
| Islandia | 0 | 0.00% | 0 | 0.00% | |||||||||
| Italia | 15,652 | 22.08% | 11,117 | 17.12% | |||||||||
| Luxemburgo | 9 | 0.01% | 10 | 0.02% | |||||||||
| Mónaco | 7 | 0.01% | 21 | 0.03% | |||||||||
| Noruega | 53 | 0.07% | 61 | 0.09% | |||||||||
| Polonia | 89 | 0.13% | 64 | 0.10% | |||||||||
| Portugal | 285 | 0.40% | 104 | 0.16% | |||||||||
| Rep. Checa | 37 | 0.05% | 14 | 0.02% | |||||||||
| Rumania | 7 | 0.01% | 3 | 0.00% | |||||||||
| Rusia | 62 | 0.09% | 40 | 0.06% | |||||||||
| Slovenia | 0 | 0.00% | 7 | 0.01% | |||||||||
| Suecia | 285 | 0.40% | 696 | 1.07% | |||||||||
| Suiza | 1,395 | 1.97% | 1,246 | 1.92% | |||||||||
| Otros | 274 | 0.39% | 954 | 1.47% | |||||||||
| SUMA | 70,899 | 100.00% | 64,937 | 100.00% | |||||||||